
One incident. Every clue. One owner.
IndraTrace brings alerts, distributed traces, logs, security findings and LLM calls together on one incident that a person owns. Built on OpenTelemetry, with one API key per product and unlimited team members.
Request early accessFor app, AI and security incidents
Team members, never charged per seat
To instrument a Python or Node.js app
For a new alert rule to start watching
Your incident, as a trace.
Before, the alert, the evidence and the owner lived in five tools. In IndraTrace they're spans of one story.
An alert rule fires
A rule you wrote in plain language crosses its threshold.
One incident opens
Not a pile of alerts: one incident with severity, status and a timeline.
Someone owns it
The on-call for that product is assigned from the rotation.
The evidence is already there
Trace, log line, AI call and any security finding, on the same page.
Resolved, on the record
Every action lands in an append-only audit trail.
Everything on-call needs, in one place.
Incident management, tracing, logs, AI cost and security in one dataset. One dataset, one queue, one owner per incident.
Every product's health on one screen
Requests, error rate, p95 latency, AI cost and user feedback across every product, with SLA watch, the slowest endpoints and what's new in this window.
- Top error products and SLA breaches
- AI spend by product
- Incidents that need attention, with owners
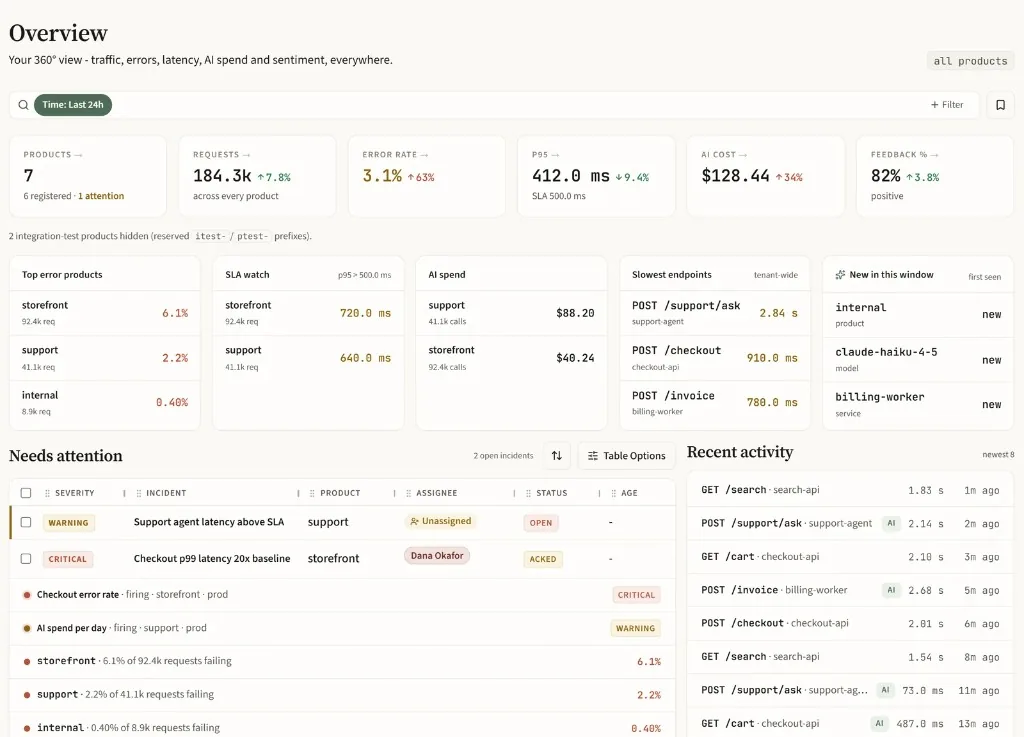
Screens shown with a demo organisation.
See what every LLM call costs.
Not a separate meter. Model calls, agent runs and tool calls sit in the same trace as the request. Tokens come from the provider, and IndraTrace prices them on its side, so spend is consistent across Anthropic, OpenAI, Gemini and Bedrock.
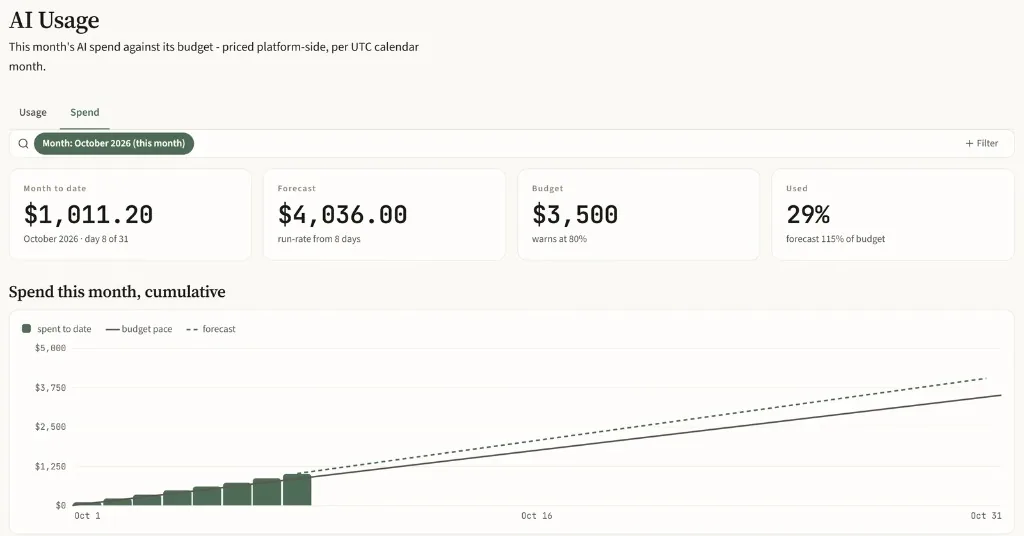
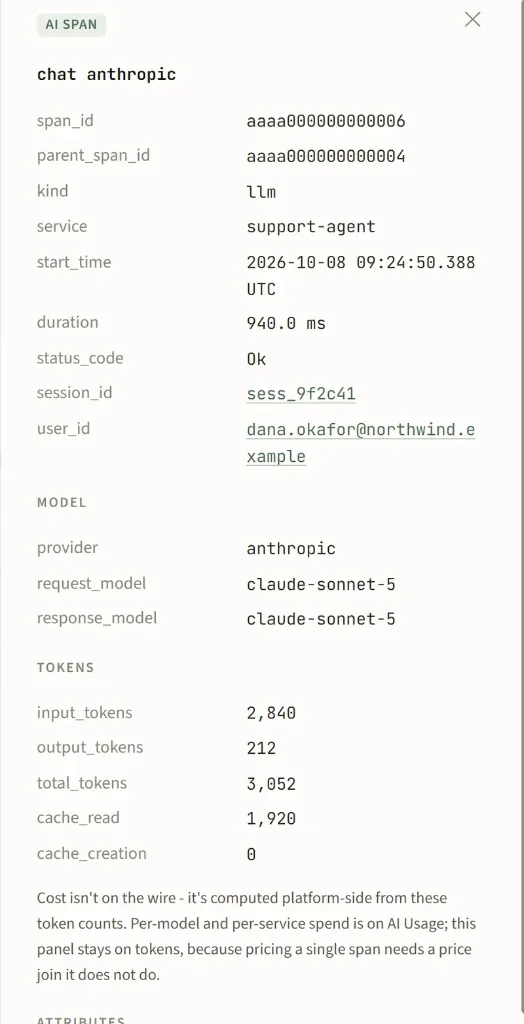
- Cost per call, by model, product and environment
- A monthly budget with an early warning and a month-end forecast
- Cache hit ratio, so prompt-caching savings are visible
- Agent runs as traces; a stuck agent becomes an incident
- Prompt and completion text off unless you turn it on
OpenTelemetry setup in one line.
One API key per product and environment carries everything: which tenant, which product, which environment. No vendor agent on every host, and the same code runs on every box.
# pip install "indratrace[fastapi]"
from fastapi import FastAPI
from indratrace import init_observability

init_observability(api_key="it_live_…")

app = FastAPI() # every request is now a spanBuilt for the people who carry the pager.
On-call engineers
Open the incident and the trace, the log line and the AI call are already on it. Acknowledge, investigate and resolve in one place.
Engineering leads
See every product's health, SLA breaches and open incidents on one screen, and know there's an owner for each.
Teams shipping AI
Know what each model call costs, keep spend inside a budget, and catch agents stuck in a loop before users do.
Security and compliance
Scanner findings land in the same queue, with SSO, per-organisation isolation and an append-only audit trail.
Built differently from a typical observability platform.
| A typical platform | IndraTrace | |
|---|---|---|
| On-call | A separate paging tool | Rotations built in, assigned to the incident |
| Incidents | Beside the dashboards | The front page, each with an owner |
| AI calls | A separate meter | In the same trace as the request |
| Setup | A vendor agent per language or host | One OpenTelemetry key, one line |
| Security findings | Usually another tool | The same incident queue |
The tools your team already uses.
Ready for your security review.
- Access
- SAML SSO, owner and member roles
- Isolation
- Each organisation's data isolated at query time
- Record
- Append-only audit trail, to Splunk or pulled
- Hosting
- US, Microsoft Azure, encrypted in transit and at rest
- AI text
- Prompts and completions off unless you turn them on
- SOC 2
- Examination in progress, not yet certified
What's coming next.
Planned, not shipped. We'd rather you choose IndraTrace for what it does today.
When is IndraTrace available, and how is it priced?
IndraTrace is coming soon, and pricing will be published at launch, with every feature and unlimited team members on every account. Talk to our team in the meantime.
Which Python frameworks and AI providers are supported?
FastAPI, Django and Flask each have an install extra, and plain scripts work too. Add the provider you call (Anthropic, OpenAI, Gemini, Bedrock or the Claude Agent SDK) to get model spans with exact, provider-reported token counts.
Which languages are supported?
Python and Node.js take one line. Java, .NET, Go, Ruby and PHP send through their own OpenTelemetry exporter with the same key.
Does IndraTrace use AI to diagnose incidents?
No. It records the AI calls your own apps make (tokens, cost and agent steps) in the same trace as the request. It doesn't use a model to diagnose or recommend.
Where is my data hosted, and for how long?
In the United States on Microsoft Azure. Telemetry is kept for 30 days by default, and you can change that. Deleting a product or organisation ends access immediately.
Is IndraTrace SOC 2 certified?
Not yet. A SOC 2 examination is in progress.
Give every incident an owner.
IndraTrace is coming soon. Book a demo and we'll walk you through it with your own services.